Hypothesis Testing (っ^▿^)
- jiamin20
- Feb 4, 2022
- 3 min read
Updated: Feb 5, 2022
First of all, let me introduce you to my groupmates:
Jia Min (Thor)
Amelia (Iron Man)
Marcus (Black Widow)
Syufyan (Hawkeye)

AVENGERS ASSEMBLE! 👟✊🏻🥷🏻
Data collected for FULL factorial design using CATAPULT A

Data collected for FRACTIONAL factorial design using CATAPULT B

QUESTION
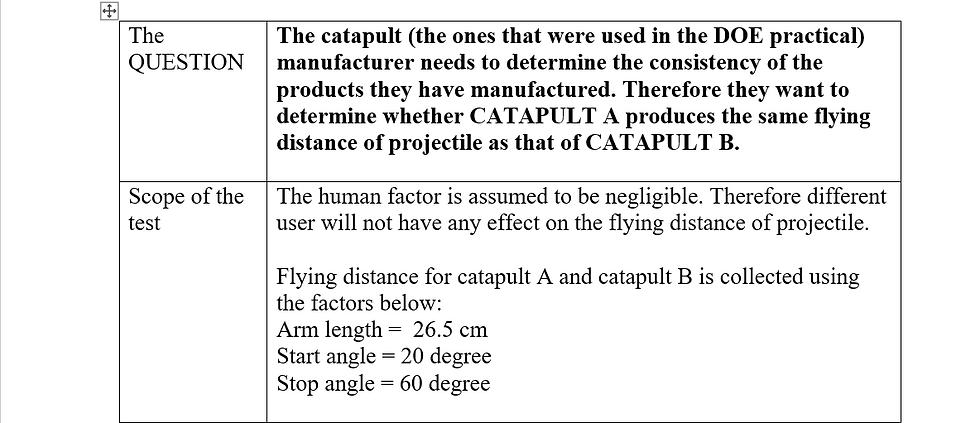
The catapult (the ones that were used in the DOE practical) manufacturer needs to determine the consistency of the products they have manufactured. Therefore they want to determine whether CATAPULT A produces the same flying distance of projectile as that of CATAPULT B.
Scope of the test
The human factor is assumed to be negligible. Therefore different user will not have any effect on the flying distance of projectile.
Flying distance for catapult A and catapult B is collected using the factors below:
Arm length = 26.5 cm
Start angle = 20 degree
Stop angle = 60 degree
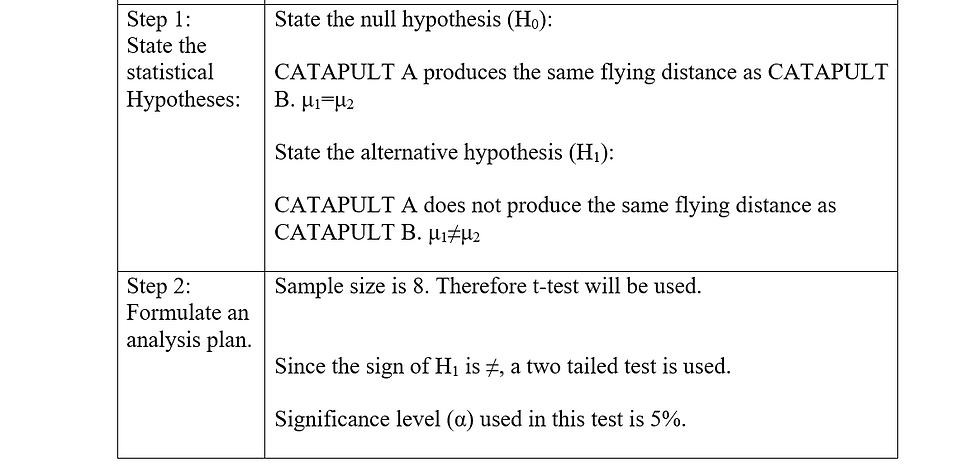
Step 1: State the statistical Hypotheses
State the null hypothesis (H0):
CATAPULT A produces the same flying distance as CATAPULT B. μ1=μ2
State the alternative hypothesis (H1):
CATAPULT A does not produce the same flying distance as CATAPULT B. μ1≠μ2
Step 2: Formulate an analysis plan
Sample size is 8 (n=8)
Therefore t-test will be used.
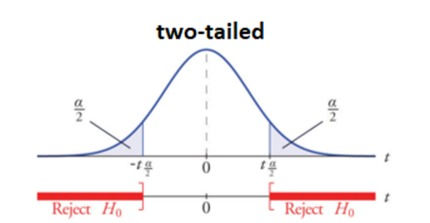
Since the sign of H1 is ≠ , a two tailed test is used.
Significance level (α) used in this test is 5%.
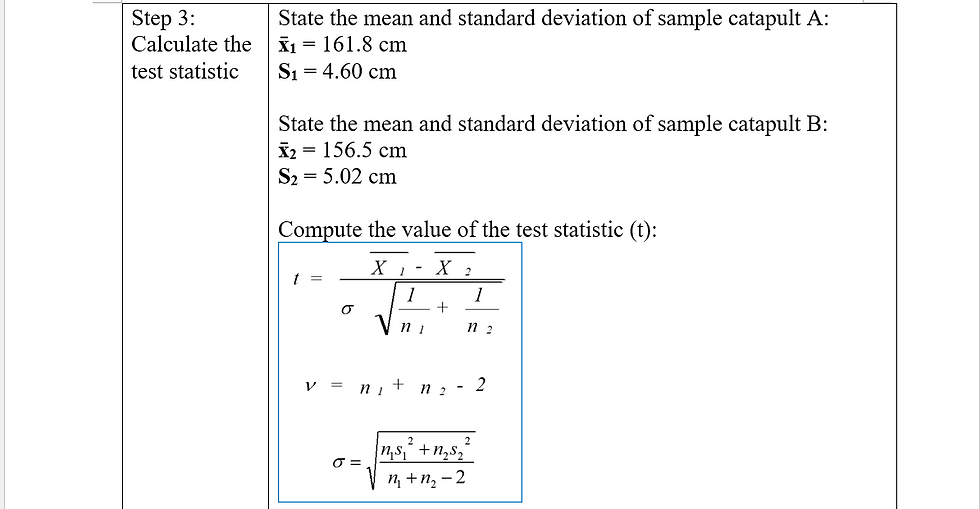
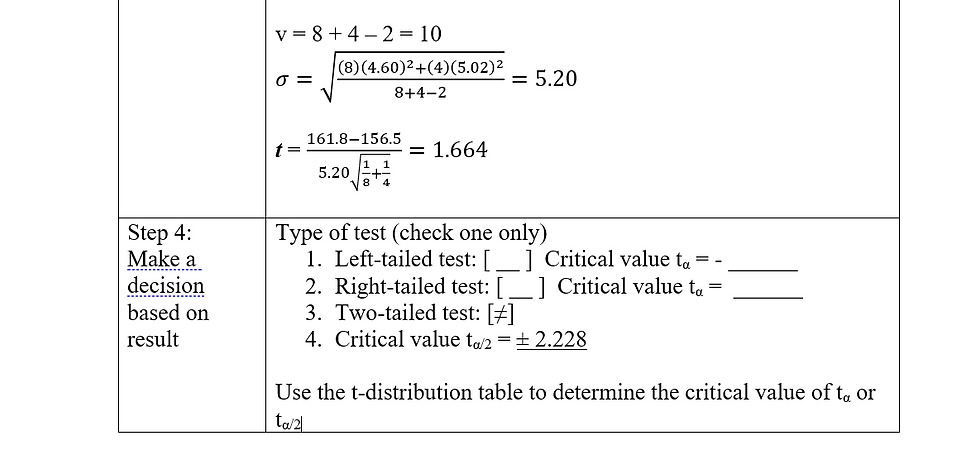
Step 3: Calculate the test statistic
State the mean and standard deviation of sample catapult A:
x̄1 = 161.8 cm
S1 = 4.60 cm
State the mean and standard deviation of sample catapult B:
x̄2 = 156.5 cm
S2 = 5.02 cm
Compute the value of the test statistic (t):


Step 4: Make a decision based on result
Type of Test
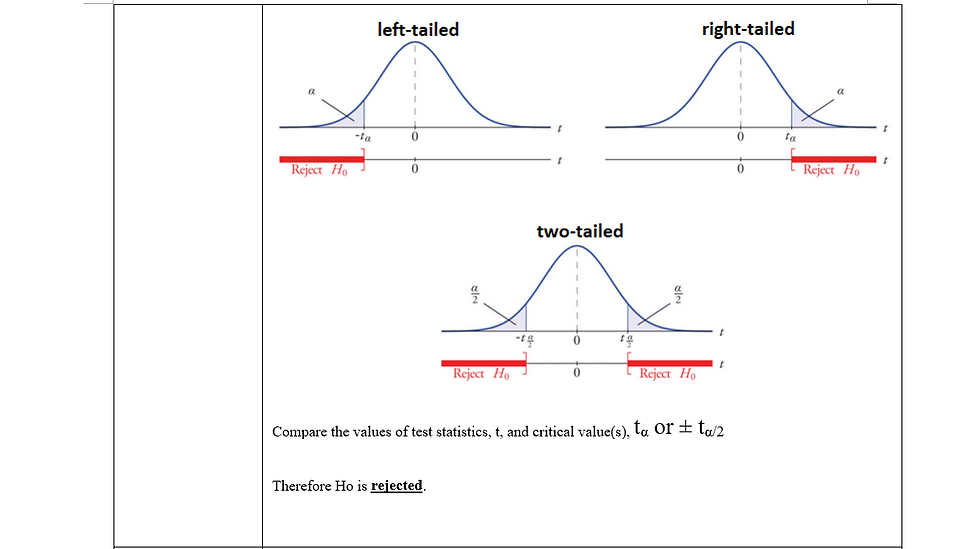
Two-tailed test [≠] Critical value tα/2 = ± 2.228 cm
Since t is within the acceptance region, null hypothesis (Ho) is accepted and alternate hypothesis (H1) is rejected.
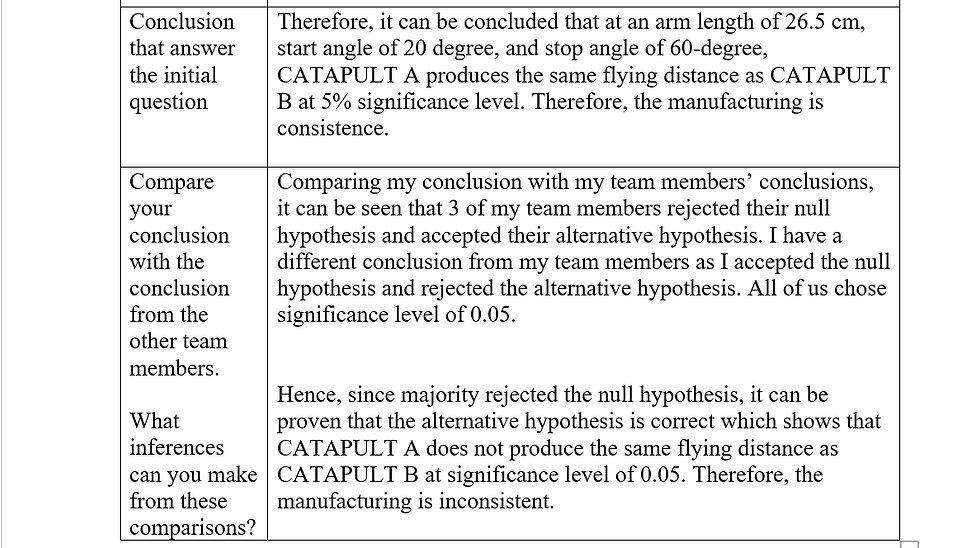
Therefore, it can be concluded that at an arm length of 26.5 cm, start angle of 20-degree, and stop angle of 60-degree, CATAPULT A produces the same flying distance as CATAPULT B at 5% significance level. Therefore, the manufacturing is consistent.
Comparing my conclusion with my team members’ conclusions, it can be seen that 3 of my team members rejected their null hypothesis and accepted their alternative hypothesis. I have a different conclusion from my team members as I accepted the null hypothesis and rejected the alternative hypothesis. All of us chose significance level of 0.05.
Hence, since majority rejected the null hypothesis, it can be proven that the alternative hypothesis is correct which shows that CATAPULT A does not produce the same flying distance as CATAPULT B at significance level of 0.05. Therefore, the manufacturing is inconsistent.
REFLECTION:
Since I took Statistics as my elective module, hypothesis testing was a great recap for me as I just have to apply what I have learnt during my elective lesson and I was able to understand the practice questions without much difficulties. However, through the lesson and the practical session, I learnt how important it is to come out with a hypothesis before conducting any experiment. I also learnt how to apply hypothesis testing and Design of Experiment (DOE) together. In this case, we have to apply the DOE knowledge we have learnt previously to conduct our practical and with the results we obtained, we have to fill in the FULL factorial design table as well as the FRACTIONAL factorial design table.
From there, we apply hypothesis testing by coming out with a suitable hypotheses based on the question given and work out the steps to calculate the value of the test statistics. Lastly, we have to compare the value we obtained to the critical value obtained from the table. It is then possible to come out with a conclusion that solves the question. Hence, I am now able to see the connection between DOE and hypothesis testing and will definitely use these two for future data analysis.
And that is all for my blog! ☃️
Comments